Exploring Flash.Trade’s Robustness: Surviving Crypto’s Extreme Volatility
In the fast-paced world of crypto trading and LPing, ensuring the stability and resilience of the protocol is paramount. One such protocol design that has gained significant attention is the Pool-to-Peer (P2P) model, where Traders and Liquidity Providers (LPs) engage in continuous interactions to generate returns for themselves. In this blog, we delve into the intricate process of establishing a simulation environment for a P2P protocol, analyzing user journeys, assessing risk factors, and ultimately testing its robustness against extreme market volatility.
Understanding User Journeys: Traders and LPs
To comprehend the dynamics of the P2P protocol, we first delve into the user journeys of both Traders and LPs. Traders have the option to go long or short on assets, while LPs can choose to add or remove liquidity from the pool. Our objective was to determine the actions that directly influence the Flash Liquidity Pool (FLP) and protocol performance in terms of returns.
Identifying Risk Factors
The next crucial step involved identifying collective actions that could pose the highest risk to the FLP. For instance, if a significant portion of users were to short a particular cryptocurrency and their predictions proved correct, the FLP would suffer a reduction in the value of crypto assets in the pool, in addition to having to pay out profits for successful shorts.
Parameters and Setup
With a comprehensive understanding of user behavior and risk factors, we introduced all the initial parameters required for the pricing function, dynamic fee model with swaps and liquidity adjustments. The FLP’s initial balance was also established, laying the foundation for our simulation environment.
Stress Testing Against Extreme Volatility
To ensure the protocol’s resilience in the face of extreme market volatility, we selected the most volatile weeks in the cryptocurrency market for our simulations. Notable examples include the FTX crash, Luna Crash, and the March 2023 pump. By running simulations with a diverse group of traders and LPs acting in a pseudo-random manner across these volatile weeks, we aimed to verify the protocol’s ability to withstand severe market turbulence.
Emphasis on Robustness, Not Profitability
It’s important to emphasize that our analysis prioritized the robustness of the protocol over its profitability. While profitability is a critical aspect, ensuring the protocol’s survival and stability in the most adverse market conditions took precedence in this study.
The Depth of Our Simulations
Our simulation environment was meticulously crafted with 300 Traders and 100 LPs, creating a complex ecosystem of interactions. The dataset generated after each simulation amounted to a staggering 3.2 gigabytes, underscoring the depth and granularity of our approach. The codebase encompassed a 1000+(update with actual) number of lines, ensuring the accuracy and authenticity of our simulation environment.
Results
In this section we’ll look at some of the results including the initial conditions that were used to run the simulation performance dates in the sample. Then we’ll look at more specific results of the pool’s performance relative to from time periods such as the Luna Crash, FTX Bankruptcy, and the 2023 March pump.
We at Flash are huge proponents of open source first as an effort to both push the space forward and the additional security from having all types of perspectives viewing the code and methodologies. You are able to download the raw data from the Monte Carlo simulations as well as the simulation environment here: https://github.com/flash-trade/flash-perpetuals/tree/master/simulations
Firstly, here are some of the initialization parameters for the simulation environment.
Simulations have been run with 9 Monte Carlo iterations of 8 events, using minute price data. Thanks to Pyth’s data team, we were able to use historical slot-by-slot price data as reported by Pyth. Then we abstracted minute-by-minute data from those feeds to ultimately end up with the data set on which these simulations were ran on.
Each event had the following properties, which were universal across all of the simulations:
- Initial liquidity of 1 BTC and the following currencies, with target_ratios = {BTC: 23%, SOL: 5%, ETH: 24%, USDC: 30%, USDT: 18%}, based on the first price of the given event.
- Each event started with 200 traders and 70 liquidity providers, with a 1% chance of gaining additional traders and 1% chance of gaining additional liquidity providers each minute.
- Per minute 0.03% chance of a long and 0.04% chance of a short for each trader.
- Per minute 0.03% chance of a swap into and out of each asset.
The main purpose of these risk simulations were to identify issues with FLP when it came to surviving some of the harshest market movements the crypto markets have experienced in the last few years. While FLP would not be immune to drawdowns as at its core it is an index of BTC, ETH, SOL and USDC/USDT, it is important that it responds predictably with the price action of crypto assets while providing extra yield during the less volatile times as people trade with it. Furthermore, it does this while avoiding existential risk to the LPs.
Let’s first look at how the Pool token value (i.e pool performance) vs BTC price across a variety of dates. It is important to note that the pool is reaching equilibrium within the first 30 min and as such will reach some extreme values as it finds a balance between LPs and Yield.
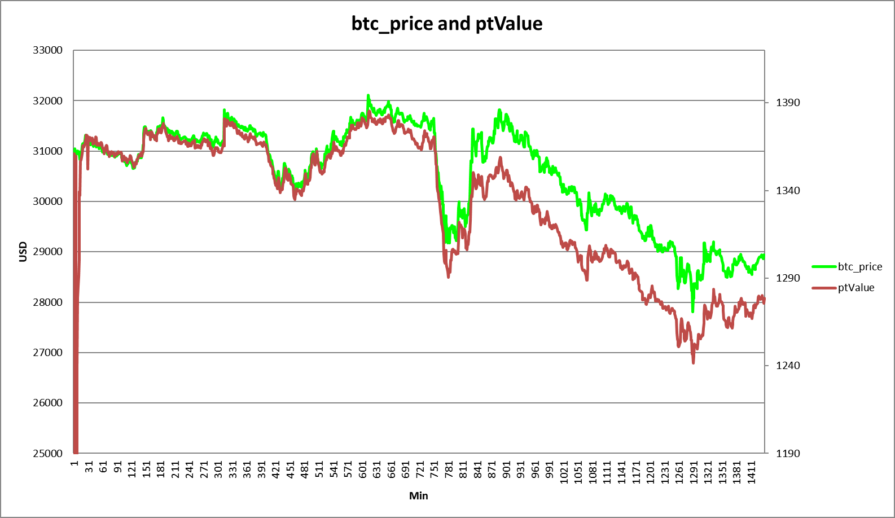
05-11-2022 LUNA Crash
While in this instance the Pool Token Value performed worse than a BTC hold, we will see this is not often the case. During moments of high volatility performance is going to depend a lot on traders positions as significant PnL swings is being experienced by them of which the pool is liable for. Sometimes, the traders get it right but just as often they will get it wrong as well as can be seen in the other reactions of BTC vs Pool Token Value.
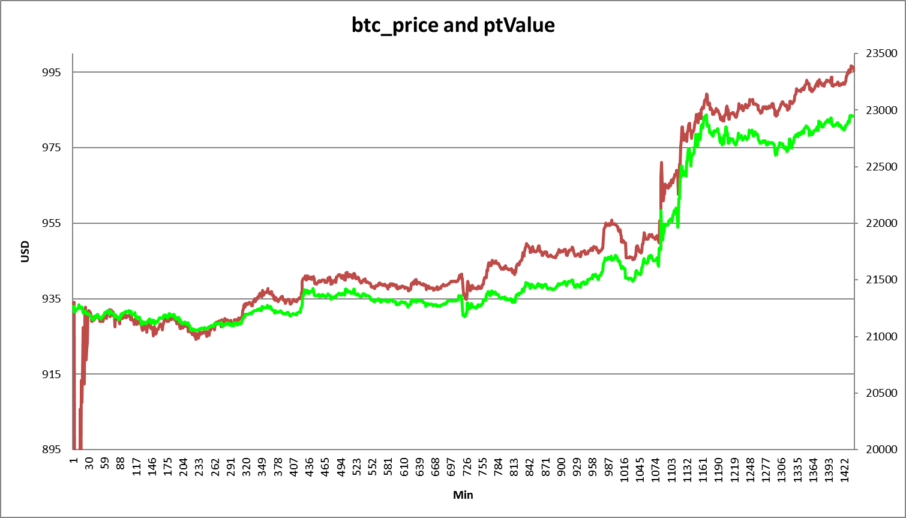
07-27-2022 Sudden Pump
Here the ptValue performs better than BTC PA during a large spike in price despite the index being only weighed 50% towards crypto.

11-08-2022 FTX Bankruptcy.
This was during the FTX Bankruptcy where there many large price movements. Nevertheless, the pool value still enjoyed better performance than a pure BTC hold during a downward move.
Conclusion
As we can see, the Pool’s value moves along with crypto values pretty closely but with on average an additional yield from spot trading and margin fees from traders wanting levered positions. This was what was intended in the design and is being validated through these simulations.
In the realm of Pool-to-Peer protocols, maintaining stability and robustness is a daunting challenge, especially in the highly volatile cryptocurrency market. Through our comprehensive simulation approach, we aimed to shed light on the protocol’s ability to survive extreme market conditions. By analyzing user behavior, identifying risk factors, and subjecting the protocol to simulations based on historical volatile weeks, we gained insights into its resilience. This study serves as a testament to the importance of stress-testing protocols to ensure their longevity and effectiveness in the face of uncertainty.
Stay updated by following @FlashTrade_ and joining our discord here.